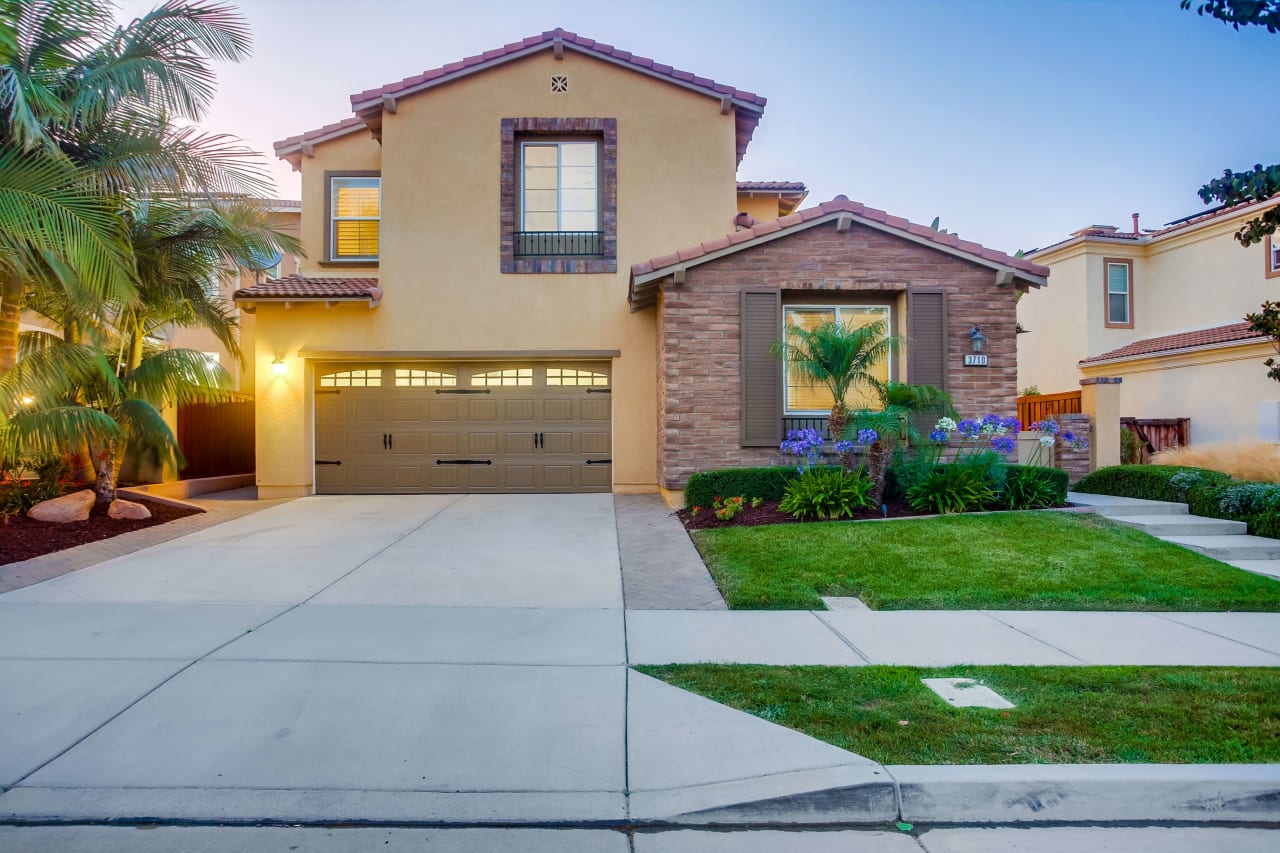
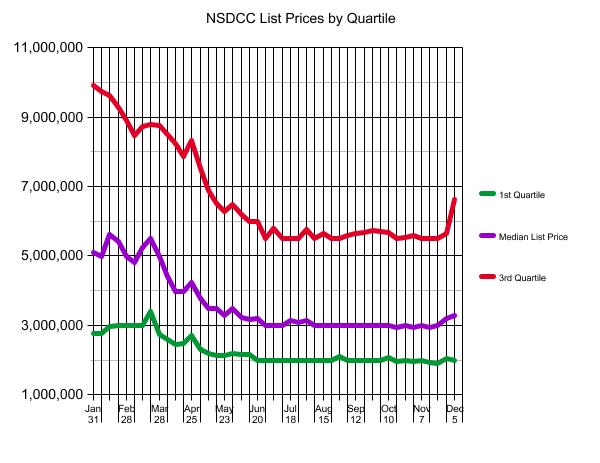
Inventory Watch: December 5, 2022
A few more articles like this should cause buyers to question whether pricing will get any better:
Today, the Data & Analytics division of Black Knight released its latest Mortgage Monitor Report, based upon the company’s industry-leading mortgage, real estate and public records datasets. Despite home price corrections continuing in many markets nationwide driven by tight affordability and higher rates, the pace of price declines has slowed measurably over the past two months. As Black Knight Data & Analytics President Ben Graboske explains, what would ordinarily be an environment ripe for steep declines in home prices has been offset somewhat by stagnant levels of for-sale inventory.
“We’ve now seen four consecutive months of home price pullbacks at the national level,” said Graboske. “But after a couple of significant drops earlier in the summer, the pace of cooling has slowed considerably, with October’s non-seasonally adjusted drop of just 0.43% the smallest decline yet. Though seemingly counterintuitive, the much higher rate environment may be limiting the pace of price corrections due to its dampening effect on inventory inflow and subsequent gridlock in home sale activity. While the median home price is now 3.2% off its June peak – down 1.5% on a seasonally adjusted basis – in a world of interest rates 6.5% and higher, affordability remains perilously close to a 35-year low. Add in the effects of typical seasonality and one might expect a far steeper correction in prices than we have endured so far, but the never-ending inventory shortage has served to counterbalance these other factors. Indeed, the volume of new for-sale listings in October was 19% below the 2017-2019 pre-pandemic average. This marks the largest deficit in six years outside of March and April 2020 when much of the country was in lockdown – with the overall market still more than half a million listings short of what we’d consider ‘normal’ by historical measures.
The $0 – $1,500,000 Market:
| Date |
NSDCC Active Listings |
Avg. LP/sf |
Avg. DOM |
# of Pendings |
| Jan 3, 2022 |
9 |
$832/sf |
35 |
36 |
| Jan 10 |
9 |
$766/sf |
28 |
29 |
| Jan 17 |
13 |
$773/sf |
26 |
27 |
| Jan 24 |
9 |
$818/sf |
15 |
29 |
| Jan 31 |
14 |
$752/sf |
14 |
31 |
| Feb 7 |
13 |
$774/sf |
12 |
32 |
| Feb 14 |
11 |
$826/sf |
12 |
35 |
| Feb 21 |
7 |
$889/sf |
17 |
38 |
| Feb 28 |
12 |
$888/sf |
17 |
33 |
| Mar 7 |
9 |
$1,017/sf |
21 |
33 |
| Mar 14 |
14 |
$847/sf |
18 |
31 |
| Mar 21 |
8 |
$912/sf |
26 |
36 |
| Mar 28 |
10 |
$914/sf |
25 |
28 |
| Apr 4 |
10 |
$782/sf |
33 |
34 |
| Apr 11 |
19 |
$733/sf |
21 |
36 |
| Apr 18 |
16 |
$795/sf |
28 |
34 |
| Apr 25 |
18 |
$891/sf |
27 |
30 |
| May 2 |
22 |
$822/sf |
23 |
31 |
| May 9 |
24 |
$887/sf |
17 |
46 |
| May 16 |
25 |
$783/sf |
22 |
25 |
| May 23 |
29 |
$782/sf |
23 |
29 |
| May 30 |
30 |
$782/sf |
24 |
28 |
| Jun 6 |
34 |
$763/sf |
25 |
28 |
| Jun 13 |
33 |
$802/sf |
29 |
29 |
| Jun 20 |
48 |
$774/sf |
28 |
22 |
| Jun 27 |
43 |
$755/sf |
32 |
22 |
| Jul 4 |
49 |
$757/sf |
33 |
23 |
| Jul 11 |
56 |
$757/sf |
35 |
22 |
| Jul 18 |
51 |
$741/sf |
38 |
24 |
| Jul 25 |
53 |
$755/sf |
38 |
22 |
| Aug 1 |
46 |
$736/sf |
36 |
29 |
| Aug 8 |
43 |
$746/sf |
41 |
32 |
| Aug 15 |
37 |
$775/sf |
37 |
34 |
| Aug 22 |
36 |
$766/sf |
41 |
33 |
| Aug 29 |
34 |
$750/sf |
40 |
39 |
| Sep 5 |
28 |
$717/sf |
50 |
31 |
| Sep 12 |
31 |
$736/sf |
52 |
29 |
| Sep 19 |
32 |
$753/sf |
36 |
27 |
| Sep 26 |
31 |
$726/sf |
39 |
28 |
| Oct 3 |
34 |
$733/sf |
34 |
22 |
| Oct 10 |
30 |
$729/sf |
36 |
27 |
| Oct 17 |
36 |
$725/sf |
36 |
23 |
| Oct 24 |
39 |
$723/sf |
39 |
24 |
| Oct 31 |
39 |
$732/sf |
38 |
24 |
| Nov 7 |
40 |
$782/sf |
39 |
25 |
| Nov 14 |
48 |
$742/sf |
41 |
20 |
| Nov 21 |
51 |
$740/sf |
46 |
18 |
| Nov 28 |
41 |
$777/sf |
59 |
23 |
The $1,500,000 – $2,000,000 Market:
| Date |
NSDCC Active Listings |
Avg. LP/sf |
Avg. DOM |
# of Pendings |
| Jan 3, 2022 |
8 |
$842/sf |
52 |
36 |
| Jan 10 |
13 |
$751/sf |
28 |
29 |
| Jan 17 |
16 |
$736/sf |
33 |
27 |
| Jan 24 |
16 |
$801/sf |
17 |
27 |
| Jan 31 |
15 |
$696/sf |
14 |
34 |
| Feb 7 |
15 |
$765/sf |
17 |
34 |
| Feb 14 |
10 |
$726/sf |
19 |
38 |
| Feb 21 |
19 |
$715/sf |
15 |
39 |
| Feb 28 |
9 |
$660/sf |
12 |
46 |
| Mar 7 |
16 |
$789/sf |
15 |
46 |
| Mar 14 |
17 |
$837/sf |
8 |
44 |
| Mar 21 |
18 |
$867/sf |
11 |
43 |
| Mar 28 |
14 |
$838/sf |
15 |
48 |
| Apr 4 |
18 |
$762/sf |
25 |
42 |
| Apr 11 |
23 |
$774/sf |
15 |
39 |
| Apr 18 |
22 |
$792/sf |
17 |
41 |
| Apr 25 |
18 |
$810/sf |
20 |
41 |
| May 2 |
27 |
$809/sf |
17 |
37 |
| May 9 |
33 |
$837/sf |
17 |
46 |
| May 16 |
39 |
$793/sf |
19 |
44 |
| May 23 |
43 |
$793/sf |
22 |
44 |
| May 30 |
36 |
$843/sf |
23 |
36 |
| Jun 6 |
43 |
$817/sf |
23 |
41 |
| Jun 13 |
49 |
$845/sf |
24 |
42 |
| Jun 20 |
57 |
$817/sf |
24 |
41 |
| Jun 27 |
75 |
$807/sf |
24 |
35 |
| Jul 4 |
70 |
$827/sf |
27 |
33 |
| Jul 11 |
71 |
$812/sf |
30 |
38 |
| Jul 18 |
74 |
$793/sf |
32 |
35 |
| Jul 25 |
83 |
$787/sf |
34 |
29 |
| Aug 1 |
81 |
$780/sf |
35 |
31 |
| Aug 8 |
76 |
$796/sf |
40 |
30 |
| Aug 15 |
80 |
$789/sf |
42 |
38 |
| Aug 22 |
78 |
$801/sf |
46 |
38 |
| Aug 29 |
81 |
$811/sf |
51 |
40 |
| Sep 5 |
82 |
$795/sf |
50 |
31 |
| Sep 12 |
78 |
$796/sf |
53 |
29 |
| Sep 19 |
73 |
$818/sf |
47 |
34 |
| Sep 26 |
75 |
$795/sf |
45 |
33 |
| Oct 3 |
75 |
$826/sf |
42 |
31 |
| Oct 10 |
69 |
$853/sf |
45 |
27 |
| Oct 17 |
73 |
$841/sf |
46 |
22 |
| Oct 24 |
72 |
$857/sf |
45 |
27 |
| Oct 31 |
74 |
$837/sf |
51 |
37 |
| Nov 7 |
69 |
$840/sf |
51 |
37 |
| Nov 14 |
65 |
$832/sf |
58 |
36 |
| Nov 21 |
62 |
$829/sf |
54 |
31 |
| Nov 28 |
55 |
$817/sf |
55 |
34 |
The $2,000,000 – $3,000,000 Market:
| Date |
NSDCC Active Listings |
Avg. LP/sf |
Avg. DOM |
# of Pendings |
| Jan 3, 2022 |
18 |
$1,080/sf |
127 |
43 |
| Jan 10 |
23 |
$1,038/sf |
85 |
37 |
| Jan 17 |
26 |
$1,044/sf |
80 |
41 |
| Jan 24 |
28 |
$1,015/sf |
37 |
42 |
| Jan 31 |
22 |
$949/sf |
38 |
47 |
| Feb 7 |
26 |
$919/sf |
29 |
42 |
| Feb 14 |
22 |
$997/sf |
37 |
49 |
| Feb 21 |
21 |
$966/sf |
33 |
54 |
| Feb 28 |
26 |
$905/sf |
32 |
57 |
| Mar 7 |
29 |
$922/sf |
28 |
57 |
| Mar 14 |
20 |
$852/sf |
26 |
58 |
| Mar 21 |
17 |
$928/sf |
26 |
60 |
| Mar 28 |
34 |
$927/sf |
12 |
65 |
| Apr 4 |
32 |
$927/sf |
20 |
69 |
| Apr 11 |
44 |
$910/sf |
17 |
62 |
| Apr 18 |
48 |
$997/sf |
19 |
66 |
| Apr 25 |
42 |
$1,092/sf |
18 |
73 |
| May 2 |
54 |
$995/sf |
19 |
70 |
| May 9 |
61 |
$910/sf |
20 |
73 |
| May 16 |
64 |
$977/sf |
22 |
69 |
| May 23 |
82 |
$953/sf |
25 |
59 |
| May 30 |
78 |
$951/sf |
27 |
56 |
| Jun 6 |
94 |
$963/sf |
27 |
58 |
| Jun 13 |
98 |
$961/sf |
28 |
70 |
| Jun 20 |
91 |
$935/sf |
32 |
59 |
| Jun 27 |
111 |
$894/sf |
30 |
60 |
| Jul 4 |
112 |
$910/sf |
33 |
60 |
| Jul 11 |
122 |
$912/sf |
34 |
56 |
| Jul 18 |
103 |
$893/sf |
39 |
68 |
| Jul 25 |
108 |
$883/sf |
40 |
63 |
| Aug 1 |
110 |
$887/sf |
41 |
58 |
| Aug 8 |
124 |
$941/sf |
39 |
50 |
| Aug 15 |
114 |
$945/sf |
45 |
51 |
| Aug 22 |
123 |
$948/sf |
42 |
46 |
| Aug 29 |
125 |
$938/sf |
46 |
45 |
| Sep 5 |
116 |
$948/sf |
48 |
38 |
| Sep 12 |
110 |
$908/sf |
49 |
43 |
| Sep 19 |
108 |
$928/sf |
50 |
46 |
| Sep 26 |
106 |
$926/sf |
51 |
45 |
| Oct 3 |
103 |
$941/sf |
50 |
46 |
| Oct 10 |
109 |
$987/sf |
50 |
42 |
| Oct 17 |
103 |
$969/sf |
50 |
45 |
| Oct 24 |
100 |
$953/sf |
52 |
51 |
| Oct 31 |
100 |
$961/sf |
53 |
50 |
| Nov 7 |
97 |
$960/sf |
54 |
47 |
| Nov 14 |
97 |
$970/sf |
51 |
38 |
| Nov 21 |
96 |
$975/sf |
54 |
33 |
| Nov 28 |
91 |
$986/sf |
60 |
37 |
The $3,000,000 – $4,000,000 Market:
| Date |
NSDCC Active Listings |
Avg. LP/sf |
Avg. DOM |
# of Pendings |
| Jan 3, 2022 |
19 |
$1,230/sf |
90 |
26 |
| Jan 10 |
22 |
$1,210/sf |
76 |
25 |
| Jan 17 |
19 |
$1,207/sf |
86 |
23 |
| Jan 24 |
17 |
$1,129/sf |
92 |
24 |
| Jan 31 |
21 |
$1,172/sf |
70 |
22 |
| Feb 7 |
19 |
$1,169/sf |
67 |
25 |
| Feb 14 |
19 |
$1,234/sf |
65 |
28 |
| Feb 21 |
21 |
$1,279/sf |
69 |
28 |
| Feb 28 |
22 |
$1,214/sf |
64 |
25 |
| Mar 7 |
27 |
$1,295/sf |
60 |
24 |
| Mar 14 |
27 |
$1,201/sf |
65 |
27 |
| Mar 21 |
23 |
$1,282/sf |
69 |
31 |
| Mar 28 |
25 |
$1,253/sf |
67 |
30 |
| Apr 4 |
30 |
$1,199/sf |
61 |
27 |
| Apr 11 |
32 |
$1,174/sf |
62 |
31 |
| Apr 18 |
33 |
$1,216/sf |
68 |
31 |
| Apr 25 |
33 |
$1,219/sf |
63 |
33 |
| May 2 |
37 |
$1,164/sf |
50 |
36 |
| May 9 |
33 |
$1,132/sf |
57 |
32 |
| May 16 |
40 |
$1,119/sf |
53 |
32 |
| May 23 |
40 |
$1,135/sf |
57 |
27 |
| May 30 |
40 |
$1,178/sf |
61 |
28 |
| Jun 6 |
43 |
$1,224/sf |
56 |
28 |
| Jun 13 |
48 |
$1,184/sf |
52 |
28 |
| Jun 20 |
52 |
$1,117/sf |
53 |
26 |
| Jun 27 |
60 |
$1,120/sf |
51 |
19 |
| Jul 4 |
55 |
$1,127/sf |
58 |
23 |
| Jul 11 |
68 |
$1,140/sf |
47 |
26 |
| Jul 18 |
66 |
$1,206/sf |
52 |
25 |
| Jul 25 |
65 |
$1,200/sf |
54 |
26 |
| Aug 1 |
59 |
$1,191/sf |
60 |
26 |
| Aug 8 |
58 |
$1,209/sf |
63 |
22 |
| Aug 15 |
59 |
$1,166/sf |
62 |
21 |
| Aug 22 |
57 |
$1,163/sf |
60 |
28 |
| Aug 29 |
53 |
$1,168/sf |
64 |
31 |
| Sep 5 |
48 |
$1,157/sf |
67 |
25 |
| Sep 12 |
50 |
$1,215/sf |
67 |
27 |
| Sep 19 |
46 |
$1,196/sf |
74 |
26 |
| Sep 26 |
42 |
$1,200/sf |
82 |
20 |
| Oct 3 |
42 |
$1,216/sf |
78 |
20 |
| Oct 10 |
38 |
$1,154/sf |
62 |
18 |
| Oct 17 |
34 |
$1,171/sf |
73 |
20 |
| Oct 24 |
41 |
$1,148/sf |
69 |
14 |
| Oct 31 |
36 |
$1,110/sf |
79 |
14 |
| Nov 7 |
37 |
$1,100/sf |
76 |
9 |
| Nov 14 |
39 |
$1,114/sf |
77 |
6 |
| Nov 21 |
38 |
$1,089/sf |
78 |
7 |
| Nov 28 |
35 |
$1,127/sf |
79 |
8 |
The $4,000,000+ Market:
| Date |
NSDCC Active Listings |
Avg. LP/sf |
Avg. DOM |
# of Pendings |
| Jan 3, 2022 |
100 |
$1,884/sf |
128 |
30 |
| Jan 10 |
105 |
$1,864/sf |
113 |
29 |
| Jan 17 |
109 |
$1,763/sf |
110 |
34 |
| Jan 24 |
105 |
$2,130/sf |
114 |
42 |
| Jan 31 |
102 |
$2,114/sf |
118 |
53 |
| Feb 7 |
109 |
$2,000/sf |
108 |
50 |
| Feb 14 |
108 |
$2,005/sf |
109 |
47 |
| Feb 21 |
113 |
$2,008/sf |
103 |
43 |
| Feb 28 |
111 |
$1,991/sf |
101 |
47 |
| Mar 7 |
115 |
$1,904/sf |
91 |
39 |
| Mar 14 |
121 |
$1,893/sf |
95 |
43 |
| Mar 21 |
116 |
$1,905/sf |
97 |
44 |
| Mar 28 |
104 |
$1,966/sf |
97 |
59 |
| Apr 4 |
103 |
$1,929/sf |
97 |
56 |
| Apr 11 |
106 |
$1,906/sf |
97 |
55 |
| Apr 18 |
108 |
$1,874/sf |
100 |
51 |
| Apr 25 |
116 |
$1,829/sf |
97 |
38 |
| May 2 |
117 |
$1,781/sf |
95 |
32 |
| May 9 |
116 |
$1,831/sf |
96 |
36 |
| May 16 |
124 |
$1,854/sf |
91 |
39 |
| May 23 |
125 |
$1,855/sf |
92 |
36 |
| May 30 |
129 |
$1,706/sf |
93 |
39 |
| Jun 6 |
131 |
$1,740/sf |
89 |
33 |
| Jun 13 |
132 |
$1,793/sf |
86 |
38 |
| Jun 20 |
148 |
$1,772/sf |
84 |
35 |
| Jun 27 |
153 |
$1,779/sf |
87 |
29 |
| Jul 4 |
155 |
$1,777/sf |
82 |
25 |
| Jul 11 |
164 |
$1,759/sf |
85 |
26 |
| Jul 18 |
170 |
$1,740/sf |
86 |
26 |
| Jul 25 |
178 |
$1,701/sf |
84 |
27 |
| Aug 1 |
180 |
$1,696/sf |
85 |
28 |
| Aug 8 |
173 |
$1,715/sf |
91 |
24 |
| Aug 15 |
168 |
$1,746/sf |
89 |
32 |
| Aug 22 |
160 |
$1,718/sf |
92 |
29 |
| Aug 29 |
165 |
$1,732/sf |
93 |
28 |
| Sep 5 |
162 |
$1,745/sf |
95 |
26 |
| Sep 12 |
152 |
$1,715/sf |
96 |
29 |
| Sep 19 |
155 |
$1,727/sf |
97 |
28 |
| Sep 26 |
157 |
$1,728/sf |
97 |
27 |
| Oct 3 |
150 |
$1,701/sf |
96 |
27 |
| Oct 10 |
153 |
$1,711/sf |
103 |
29 |
| Oct 17 |
152 |
$1,675/sf |
101 |
25 |
| Oct 24 |
156 |
$1,697/sf |
102 |
24 |
| Oct 31 |
157 |
$1,701/sf |
107 |
22 |
| Nov 7 |
156 |
$1,682/sf |
109 |
22 |
| Nov 14 |
154 |
$1,680/sf |
113 |
22 |
| Nov 21 |
155 |
$1,682/sf |
113 |
22 |
| Nov 28 |
155 |
$1,632/sf |
117 |
20 |
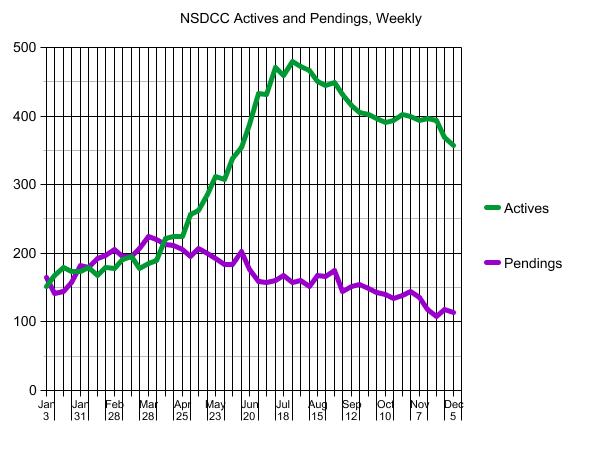
NSDCC Weekly New Listings and New Pendings
| Week |
New Listings |
New Pendings |
Total Actives |
Total Pendings |
| Jan 3, 2022 |
17 |
14 |
152 |
164 |
| Jan 10 |
39 |
18 |
167 |
142 |
| Jan 17 |
34 |
29 |
179 |
145 |
| Jan 24 |
41 |
40 |
173 |
157 |
| Jan 31 |
43 |
40 |
173 |
182 |
| Feb 7 |
43 |
38 |
179 |
179 |
| Feb 14 |
44 |
49 |
168 |
193 |
| Feb 21 |
51 |
38 |
180 |
197 |
| Feb 28 |
39 |
39 |
179 |
205 |
| Mar 7 |
54 |
37 |
191 |
195 |
| Mar 14 |
48 |
51 |
195 |
196 |
| Mar 21 |
39 |
46 |
178 |
207 |
| Mar 28 |
53 |
50 |
185 |
224 |
| Apr 4 |
46 |
40 |
190 |
220 |
| Apr 11 |
61 |
39 |
221 |
213 |
| Apr 18 |
41 |
46 |
224 |
212 |
| Apr 25 |
50 |
43 |
224 |
205 |
| May 2 |
76 |
37 |
256 |
196 |
| May 9 |
59 |
46 |
262 |
207 |
| May 16 |
78 |
48 |
286 |
200 |
| May 23 |
61 |
42 |
312 |
192 |
| May 30 |
54 |
44 |
307 |
183 |
| Jun 6 |
70 |
31 |
338 |
183 |
| Jun 13 |
60 |
41 |
354 |
202 |
| Jun 20 |
71 |
25 |
388 |
177 |
| Jun 27 |
73 |
26 |
433 |
159 |
| Jul 4 |
55 |
39 |
432 |
158 |
| Jul 11 |
55 |
24 |
471 |
161 |
| Jul 18 |
49 |
35 |
459 |
168 |
| Jul 25 |
60 |
20 |
480 |
158 |
| Aug 1 |
55 |
35 |
473 |
161 |
| Aug 8 |
40 |
32 |
466 |
151 |
| Aug 15 |
51 |
32 |
451 |
168 |
| Aug 22 |
43 |
29 |
445 |
166 |
| Aug 29 |
43 |
27 |
449 |
175 |
| Sep 5 |
31 |
22 |
432 |
144 |
| Sep 12 |
38 |
22 |
415 |
151 |
| Sep 19 |
45 |
26 |
405 |
155 |
| Sep 26 |
45 |
27 |
402 |
149 |
| Oct 3 |
46 |
19 |
396 |
143 |
| Oct 10 |
40 |
26 |
391 |
140 |
| Oct 17 |
37 |
19 |
393 |
134 |
| Oct 24 |
50 |
26 |
402 |
139 |
| Oct 31 |
26 |
19 |
399 |
144 |
| Nov 7 |
37 |
16 |
393 |
136 |
| Nov 14 |
36 |
16 |
396 |
118 |
| Nov 21 |
32 |
18 |
393 |
108 |
| Nov 28 |
13 |
17 |
369 |
118 |